QR code numbers get copied from page to page until nobody knows where they came from. This page does the opposite: every figure below links to the organization that published it, with the year, and the method section at the end says what was checked and what was left out.
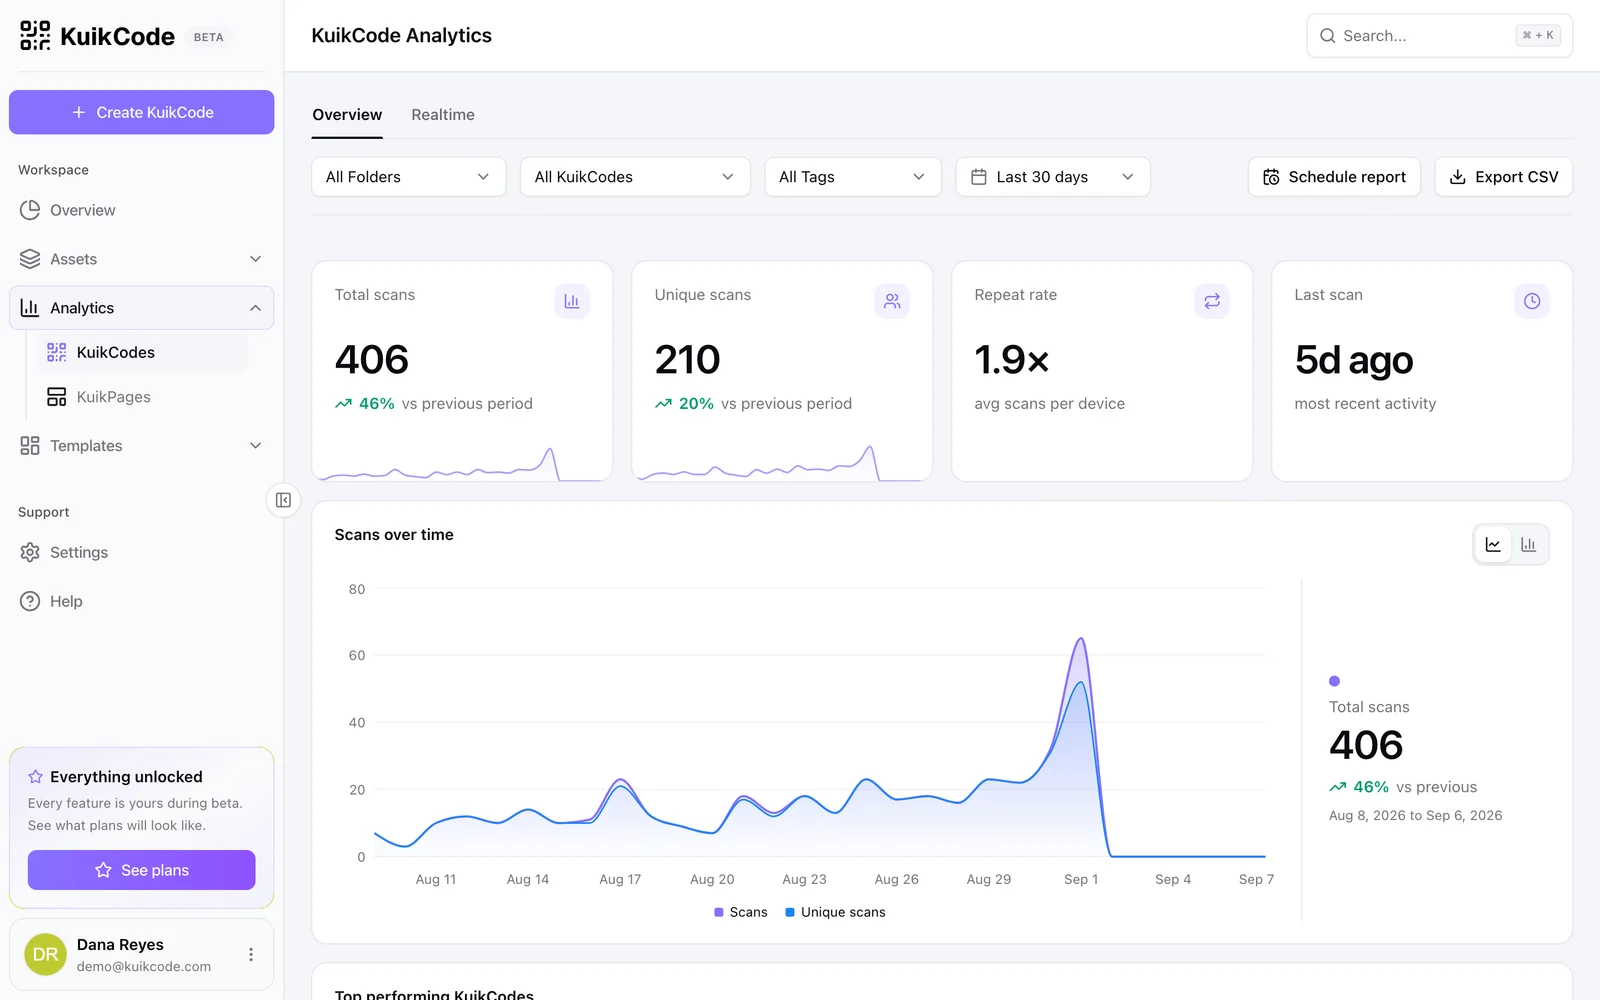
None of these numbers are KuikCode data. They come from central banks, government agencies, standards bodies, polling firms and research companies.
The key numbers at a glance
| Number | What it measures | Source |
|---|---|---|
| 633.4 million | UPI QR codes in India, December 2024 (576.9 million in June 2024) | Reserve Bank of India, 2025 |
| 10.0 million | Card terminals (PoS) in India at the same date | Reserve Bank of India, 2025 |
| 9.6% | Share of Japan's cashless payments made by QR and barcode ("code payments") in 2024, worth 13.5 trillion yen | METI, 2025 |
| $5.4 trillion | Estimated value of QR code payments worldwide in 2025, forecast to reach $8 trillion by 2029 | Juniper Research, 2025 |
| 66% | US adults who would scan a QR code on food packaging to see freshness, ingredients and shelf life | GS1 US, 2025 |
| 79% | US shoppers more likely to buy a product with a scannable barcode or QR code | GS1 US, 2024 |
| 65% | Americans who have used a QR code menu (42% in 2022) | Ipsos, 2025 |
| 58% | Americans who would like to go back to paper menus | Ipsos, 2025 |
| 784 reports, about £3.5 million | QR code fraud reported in the UK, April 2024 to April 2025 | Action Fraud, 2025 |
How many people scan QR codes?
Nobody publishes a reliable worldwide count of people who scan. The honest answer is a set of national measures, each with its own method and date.
In the US, the most recent public poll with a clear method is old but often misquoted. In a YouGov survey of 1,200 US adults in June 2021, 55% had used a QR code at a bar, restaurant, venue or store in the previous three months, 14% found QR codes difficult to use (20% of those 65 and older), and 75% were willing to use more of them in the future (YouGov, 2021).
The often repeated US user counts come from eMarketer forecasts. As reported by MediaPost in February 2022, eMarketer expected 83.4 million US adult smartphone users to scan a QR code that year, growing about 8.7% a year through 2025 (MediaPost, 2022). Newer eMarketer figures sit behind a paywall, so they are not repeated here.
Across 18 markets, a YouGov study in May 2022 found that two thirds of consumers agree QR codes are easy to use. The two exceptions were Denmark (50%) and the US (44%) (YouGov, 2022).
For scale, it helps to look back. In June 2011, comScore counted 14 million US mobile users who scanned a QR code, 6.2% of the mobile audience, and 35.3% of them had scanned one on product packaging (comScore, 2011). Today the question is less whether people can scan and more whether they want to.
One small but telling data point: when the US Census Bureau tested QR codes as a way into a survey in 2024, all 20 participants scanned the code without trouble, in 12.4 seconds on average, and the researchers could not find anyone without prior QR code experience to take part (US Census Bureau, 2024). It is a usability study, not a national estimate, but it matches what the polls suggest.
Where QR codes are used most: payments
Payments are where QR codes run at the largest scale, and the best data comes from central banks and governments.
India. The Reserve Bank of India's Payment System Report counted 633.4 million UPI QR codes in December 2024, up from 576.9 million in June 2024. At the same date the country had about 10 million card terminals (Reserve Bank of India, 2025). In other words, there were more than 60 QR codes for every card machine.
The Indian figures do not all line up. A May 2025 report by the public broadcaster DD News, citing RBI data, put UPI QR codes at 657.9 million for the 2024-25 financial year, up 91.5% (DD News, 2025). A December 2025 government statement said 568.6 million QR codes (56.86 crore) had been deployed to about 65 million merchants as of 2024-25 (Press Information Bureau, 2025). The three counts use different dates and definitions, so treat the order of magnitude, roughly 600 million, as the reliable part.
Japan. The Ministry of Economy, Trade and Industry reported that cashless payments reached 42.8% of consumer spending in 2024. Code payments, meaning QR codes and barcodes, made up 9.6% of that cashless total, worth 13.5 trillion yen (METI, 2025).
Worldwide. Juniper Research estimates that QR code payments were worth $5.4 trillion in 2025 and forecasts about $8 trillion by 2029 (Juniper Research, 2025). Forecasts like this move a lot: in May 2022, the same firm expected QR payments to pass $3 trillion by 2025 (Juniper Research, 2022). A separate April 2025 Juniper release puts Asia Pacific at $290 billion in 2025, growing to about $1.2 trillion by 2029 (Juniper Research, 2025). The releases do not explain how the regional and global figures relate, so use them as a direction, not a precise total.
Do people scan QR codes on packaging?
Many say they would, and the standards body behind the barcode is betting on it. GS1 is moving retail toward QR codes powered by GS1 that still ring up at checkout, with retailers aiming to accept them at the register by 2027.
- In a 2025 survey, GS1 US found that 66% of US adults would scan a QR code on food packaging to see information such as freshness, ingredients and shelf life, and 76% want more product information because of higher food costs (GS1 US, 2025).
- A year earlier, GS1 US reported that 77% of consumers say product information is important when they buy, and 79% of shoppers are more likely to buy a product with a scannable barcode or QR code (GS1 US, 2024).
Neither release gives a sample size, and "would scan" is an intention, not a measured scan. Still, the direction is clear: shoppers want the information, and a code on the pack is the expected way to get it. Our guide to GS1 Digital Link on packaging explains how one code can serve both the register and the phone.
Restaurant menus: high use, mixed feelings
Menus are the clearest case of a gap between use and preference.
- The Ipsos Consumer Tracker found that 65% of Americans have used a QR code menu, up from 57% in 2023 and 42% in 2022. In the same survey, 58% said they would like to go back to paper menus, only 37% said they like the digital menu experience, and 39% hope QR menus continue (Ipsos, 2025).
- A US Foods survey of 1,005 Americans in April 2024 found that 90% prefer printed menus over QR codes, up from 74% in 2023 (US Foods, 2024).
The two numbers conflict (58% against 90%) because the questions differ: Ipsos asked about going back to paper, US Foods asked people to pick a preference. Both point the same way. People scan menus because they have to, not because the experience is good. A fast, readable page behind the code is what closes that gap, which is the idea behind our guide to a digital restaurant menu.
QR code scams: small numbers, rising concern
Fake codes, sometimes called quishing, are a real but still small part of the picture.
- UK. Action Fraud, the national fraud reporting service, received 784 reports of QR code fraud between April 2024 and April 2025, with almost £3.5 million lost. Car parks were the most common setting, with stickers placed over the codes on parking machines (Action Fraud, 2025).
- US. The Federal Trade Commission warned in January 2025 that a QR code in an unexpected package can lead to a phishing site that asks for card numbers or passwords (FTC, 2025).
Reported cases are a floor, not a total, because small losses often go unreported. Our guide to whether QR codes are safe covers how to spot a fake code.
What the numbers mean if you print QR codes
Public statistics describe averages across millions of people. What matters for a flyer, a box or a table tent is how your own code performs. A few practical points follow from the data above.
- People will scan, so the page behind the code decides the result. The menu surveys show that a scan can still leave people unhappy. Send scanners to a page built for a phone, not a desktop site or a hard to read PDF.
- Printed codes outlive campaigns. Packaging and signs stay in use for years. A dynamic code lets you change the destination after printing, so the same print keeps working when the page moves. Our guide to static vs dynamic QR codes explains the difference.
- Measure your own scans. Use one code per placement, so a poster and a mailer report separately. Our guide to tracking QR code scans shows what to count.
- Design for trust and contrast. With fake codes in the news, a code that clearly belongs to your brand, with a clear call to action next to it, gives people a reason to scan. Keep dark dots on a light background so every phone can read it.
Sources and method
Checked on October 2, 2026. Every source below was opened on that date, and each figure on this page was read from that source, not from a summary of it.
How we chose sources:
- Primary first. We used central banks, government agencies, a standards body, polling firms and a research firm's own press releases. Where we could only reach a reproduction (the Action Fraud alert and the eMarketer forecast), we say so and link to the copy we read.
- No figures from QR code generator companies. Several widely cited statistics pages and trend reports are published by companies that sell QR codes. We left those numbers out, because the seller of a product is not a neutral source on its use.
- Left out when not verifiable. Several commonly quoted numbers did not make it onto this page: figures behind the Statista and eMarketer paywalls, user counts for which we could not open the original release, and survey results we found only in listicles.
- Conflicts are shown, not hidden. Where two sources disagree (India's QR code counts, menu preference), both are given with the reason they differ.
Sources:
- Reserve Bank of India, Payment System Report, December 2024 (released January 27, 2025): rbi.org.in
- DD News, "UPI QR codes record 91.5% surge to 657.9 million", May 6, 2025: ddnews.gov.in
- Press Information Bureau, Government of India, statement on UPI and digital payments infrastructure, December 8, 2025: pib.gov.in
- Ministry of Economy, Trade and Industry (Japan), "2024 Ratio of Cashless Payment Among the Total Amount Paid by Consumers Calculated", March 31, 2025: meti.go.jp
- Juniper Research, "QR Code Payments to Exceed $8tn by 2029", February 10, 2025: juniperresearch.com
- Juniper Research, "QR Code Payments to Reach $3 Trillion Globally by 2025", May 9, 2022: juniperresearch.com
- Juniper Research, "QR Code Payments: Asia Continues to Lead Global Surge in Usage", April 8, 2025: juniperresearch.com
- GS1 US, "New GS1 US Survey Finds Consumers Are Reviewing Food Labels More Closely as Grocery Prices Rise", June 23, 2025: prnewswire.com
- GS1 US, "GS1 US Celebrates 50-Year Barcode Scanniversary", June 26, 2024: gs1us.org
- Ipsos, "QR Code menus are growing even less popular", July 21, 2025: ipsos.com
- US Foods, 2024 Diner Dispatch survey (April 2024, 1,005 respondents): usfoods.com
- YouGov, "Are QR codes leaving older Americans behind?", survey of 1,200 US adults, June 16, 2021: yougov.com
- YouGov, 18 market QR code study, fieldwork May 2022, published June 24, 2022: yougov.com
- MediaPost, "83.4 Million U.S. Smartphone Users Will Scan QR Codes This Year" (reporting an eMarketer forecast), February 15, 2022: mediapost.com
- comScore, "14 Million Americans Scanned QR or Bar Codes on their Mobile Phones in June 2011", August 12, 2011: comscore.com
- US Census Bureau, "Usability of Quick Response (QR) Code as a Method to Access a Survey Using a Smartphone", working paper rsm2024-05, August 13, 2024: census.gov
- Action Fraud, "New quishing alert: £3.5 million lost last year to fraudulent QR codes", June 20, 2025, as published on Wired-Gov: wired-gov.net
- Federal Trade Commission, "Scam alert: QR code on an unexpected package", January 23, 2025: consumer.ftc.gov
Figures are replaced as newer releases come out, and the "Updated" date at the top shows the last change.
Frequently asked questions
01How many people scan QR codes?+
There is no single worldwide count. The best public measures are national. In the US, a YouGov poll in June 2021 found that 55% of adults had used a QR code at a bar, restaurant, venue or store in the previous three months. In India, the Reserve Bank of India counted about 633 million UPI QR codes in use for payments at the end of 2024.
02Are QR codes still popular in 2026?+
Yes, and use keeps growing in payments. Juniper Research estimates QR code payments at 5.4 trillion dollars worldwide in 2025 and forecasts about 8 trillion dollars by 2029. For restaurant menus, use is high but many diners say they would prefer paper.
03Do people scan QR codes on product packaging?+
Many say they would. A 2025 GS1 US survey found 66% of US adults would scan a QR code on food packaging to check freshness, ingredients and shelf life, and a 2024 GS1 US survey found 79% of shoppers are more likely to buy a product with a scannable barcode or QR code that gives more information.
04How common are QR code scams?+
Reported cases are still small next to total scans, but they are rising and often underreported. Action Fraud, the UK's national fraud reporting service, received 784 reports of QR code fraud between April 2024 and April 2025, with about £3.5 million lost. In the US, the FTC warned in January 2025 about QR codes in unexpected packages that lead to phishing sites.
05Where do these QR code statistics come from?+
Each figure links to the publisher that released it, such as the Reserve Bank of India, Japan's Ministry of Economy, Trade and Industry, GS1 US, Ipsos, YouGov and Juniper Research. Every source was opened on October 2, 2026. Figures from companies that sell QR code generators were left out.
06Does KuikCode publish its own scan statistics?+
Not yet. Every number on this page comes from a third party. Inside the product, each workspace sees its own scans by day, hour, device and location in KuikCode analytics.